What Moneyball Teaches Us About College Admissions in the Digital Age
Moneyball: The Art of Winning an Unfair Game is a book by Michael Lewis, published in 2003, about the Oakland Athletics baseball team and its general manager Billy Beane. Ignoring 100 years of established baseball best practices, the focus of the book is the team’s adoption of a disruptive analytical and evidence-based approach to assembling a competitive baseball team, known as Sabermetrics.
When Bill James first introduced Sabermetrics in the late 1970s, he changed the way baseball evaluated players and built their teams. Sabermetrics was created in an attempt to see the sport of baseball through objective evidence. Sabermetricians questioned baseball’s reliance on using “batting average” as a statistic upon which to make decisions on whether to keep or replace players. Historical data demonstrated that team batting average was a poor predictor of team runs scored. Sabermetric reasoning would say that runs win ballgames, and that a good measure of a player’s worth is his ability to help his team score more runs than the opposing team. This realization ushered in a whole new set of metrics used to assess baseball talent. (See Wikipedia)
“For generations, two numbers have signaled whether a student could hope to get into a top college: his or her standardized test score and his or her grade point average. In the past 15 years, though, these lodestars have come to mean less and less.”
— JEFFREY SELINGO
Nearly every college in the United States has introduced some level of predictive analytics and data analysis into their enrollment and admissions processes. While everyone knows how the game of baseball has changed over the past 20 years, only a few realize how much the business of college has changed as a result of big data and predictive analytics. Like batting averages in baseball, data showed that GPA and SAT scores were poor predictors of identifying students who would enroll and thrive at college. These longstanding building blocks for defining incoming freshman classes gave way to enrollment probability ratios and character assessments to better manage yield and graduation rates.
To understand why, we need to understand the influential powers of the U.S. News and World Report college rankings. College rankings have a pervasive influence on the higher education landscape by significantly affecting the number of applications colleges receive and the enrollment yield their brand power can generate. A college’s placement on the rankings list has the ability to increase perceived prestige thus automatically inducing thousands of more applicants and enrollments. Colleges realized that by actively managing the manipulable metrics of the rankings they could increase their overall status and therefore the drawing power of the college brand.
The U.S. News and World Report college ranking system is heavily weighted (22.5%) to reward colleges that retain and then graduate their students in 6 years or less. According to Robert Morse, chief data strategist at U.S. News, “A university is not successful if it does not graduate its students, which is why the Best Colleges rankings place the greatest value on outcomes, including graduation and retention rates.”
Welcome to the world of “student success” and “student fit.”
Another historically important lever used to increase rankings is student selectivity (10%) which is based on acceptance rates (the lower the better). This metric also influences academic reputation (20%). There are two practical ways a college can lower acceptance rates. The first is to increase the number of applications it receives. The second is to increase enrollment yield by decreasing the number of students accepted while still filling all available incoming seats. Predictive analytics not only help colleges generate more applications by targeting the right prospects, it also helps them make more informed acceptance decisions based on an applicant’s enrollment probability.
As colleges began actively managing to their U.S. News and World Report rankings, they realized that grades and test scores, by themselves, proved to be unreliable predictors of enrollment and student success. Just as baseball teams did a decade earlier, colleges were forced to rethink the assumptions underlying their traditional “team-building” strategies. This realization gave rise to the concepts of demonstrated interest and holistic admission reviews. Underpinning the adoption of holistic admissions is its strong correlation to measuring a student’s non-cognitive variables. Colleges that started to look beyond the traditional numbers experienced significant gains in selecting and predicting successful students regardless of incoming grade point average or SAT/ACT scores. Demonstrated interest also came into vogue as a way to better predict an applicant’s interest in enrolling at a particular college. Applicant interactions such as college visits, college fair contacts, and emails to the admissions office were used to gauge an applicant’s probability of enrollment. Unfortunately, as the Common Application was delivering thousands of applications each year, the manually driven concepts of holistic admissions and measuring demonstrated interest could not effectively scale beyond a limited number of smaller schools.
Before taking a deep dive into the technological enrollment management systems that have solved the scaling problem and have brought the world of big data and predictive analytics to the college admissions process (which will be discussed in the next installment of this series), we should examine a fundamental yet often overlooked enabler of the admissions review process.
If colleges are deploying sophisticated software systems that are programmed to focus on enrollment probabilities and graduation rates then where do GPAs and SAT/ACT scores fit in? While still an important component of assembling incoming freshman classes, these metrics work better to correlate students into groups rather than discerning between individual students.
The reasons are plain to see. First, because of the pervasiveness of high school grade inflation and the unprecedented number of college applicants, there is less discernible variance in GPA from applicant to applicant. Second, standardized test scores have long been known to be game-able while also being poor predictors of college performance. These are only two of the reasons why over 1,000 accredited 4-year colleges no longer require SAT/ACT scores for admission.
Even so, colleges inherently know that GPA and SAT/ACT reflect a student’s fundamental ability to be a good student. Colleges also are secure knowing that a predictably large percentage of their applicant pool will be delivering grades and test scores well within their acceptable range before ever looking at one college application. How do they know that?
Naviance! Naviance is a software tool widely used by high school students to determine their chances of being accepted to colleges and universities based on how their grade point averages and standardized test scores compare to previously accepted students from their high schools. A high school student who uses Naviance can enter the college in question, and the program will immediately spit out an informative scatter plot. The x-axis is the SAT scores of every applicant to that college from that high school from the past three years. The y-axis is the grade-point average. Naviance then computes the average SAT score and GPA of the students who were admitted into the queried college. Naviance also does one other thing: It highlights how a student’s own test scores and grades compare to the average admitted students.
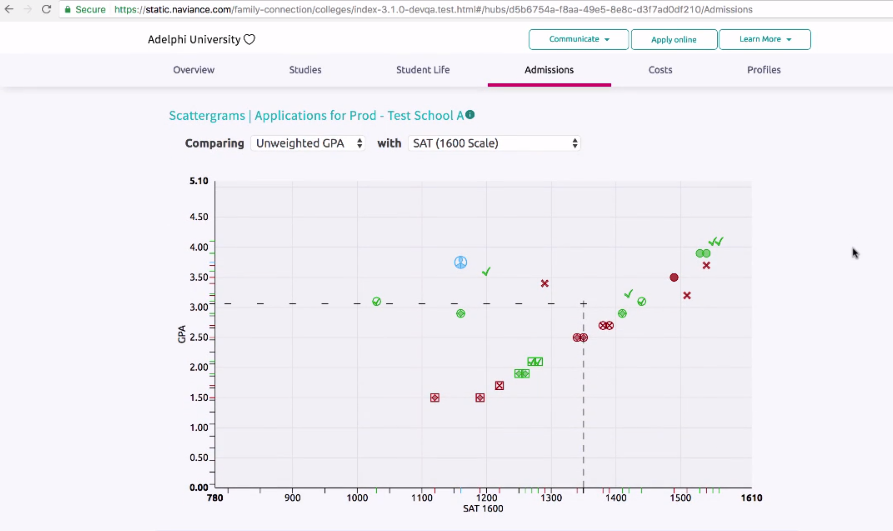
Colleges love Naviance. The rudimentary screening methodology used by Naviance delivers discrete value. By focusing on only two metrics, GPA and SAT, Naviance perpetuates a college caste system that helps keeps applicants in predetermined lanes. The outcome is that colleges can reasonably rely on Naviance to deliver an applicant pool that fits generally within that college’s historic level of acceptable academic scoring range.
Let’s explore how this works in the aggregate. For sake of argument, let’s assume best practice dictates a student should apply to 7 colleges broken out as 2 reach, 3 target, and 2 safety. With Naviance dictating which colleges are defined as reach, target, and safety for every student based on their GPA and SAT score, colleges can reasonably rely on the fact that 72% of their applicant pool will meet or exceed the school’s published GPA and SAT requirements. The remaining 18% of applicants will likely fall just below that cusp but may possess certain unique skills or diversity elements that the college is looking for. These applicants might also be considered for possessing a strong ability to pay and/or a high enrollment probability score. Even better for colleges, because Naviance only posts data from the applicant’s high school, differences between high school assessed rigor are already baked into the equation.
Naviance therefore helps deliver a reliable “eligible” applicant pool which then enables colleges to use their resources to look at other determinative factors for admission. These factors include the ability to pay (demographics, FAFSA, consumer database, social media), likelihood to enroll (website analytics, social media, college visits), and student fit (demographics, character attributes, and social media). Enrollment management systems are used to pre-screen applicants along these metrics prior to full admissions review. Colleges even use advanced analytics to optimize the use of merit aid to entice an interested “safety” applicant to enroll at their school.
“Colleges have begun to use algorithms that work on an individual-student basis to profile and predict their behavior. They use social media data, as well as the data supplied by the applications, to compute the likelihood a given student will enroll if accepted, the extent of financial aid needed by the student – or needed to seduce a relatively well-off student.”
— CATHY O’NEIL
Colleges have been deploying advanced CRM systems that actively monitor and measure a diverse set of predictive data feeds outside of the college application itself. According to the American Association of Collegiate Registrars and Admissions Officers (AACRAO), 76% of colleges now utilize some form of automated enrollment management tool and just about 90% of private, not-for-profit colleges use enrollment management projections to determine undergraduate admission targets.
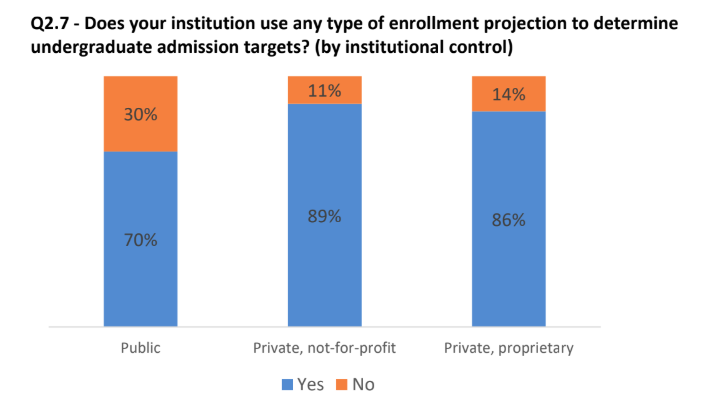
AACRAO December 2018
This was from a blog originally published by Social Assurity. In the next installment which will be published tomorrow, they will be identifying and taking a closer look at today’s most popular enrollment management systems and the data feeds that colleges actively monitor and measure to predict enrollment, college success, and ability to pay (a key metric for retention).